
In conventional medicine, your pulse can help reveal a lot of underlying problems. In the same way, if there is a single metric that is measured and tracked by every IT organization across the world then it has to be Time to First Byte (TTFB). While there are dozens of other standard and custom metrics that represent the health of an application or infrastructure, if you see a change in TTFB, then you know for sure there is a problem somewhere. That’s why I call it “the pulse of application health”.
But this is where the challenge begins because it tells you there is a problem, but it doesn’t tell you where.
Having worked in the monitoring industry for over 10 years, TTFB has been a part of every analysis, evaluation, troubleshooting or diagnosis exercise I performed for my customers. We would recommend alerting and reporting on any and all variations in TTFB.
Often customers would be able to quickly detect a problem because an alert would let them know that TTFB has slowed down. In some cases, the root cause would be obvious, but in most cases I saw a lot of “Mean Time to Innocence (MTTI)”, or in other words, a lot of finger pointing within the organization. This finger pointing happens because everybody knows there is a problem, nobody knows what exactly is causing it, and subsequently no one wishes to take responsibility.
There are many things that can cause a slowdown of TTFB. Let’s categorize these into different groups:
Traffic:
Applications and their infrastructure are fine tuned to handle a certain amount of traffic without compromising performance. Infrastructure is prepared to scale when there is a surge in traffic either by scaling up the compute resources and/or by having high cacheability.
If the infrastructure is slow to scale, then requests could queue up and in turn increase the TTFB or even lead to a complete outage. If the caching policy is incorrect or too short, then the increase in uncached resources will increase the server CPU load, which will in turn slow down TTFB.
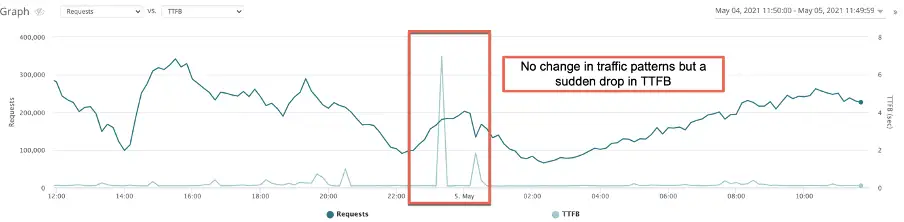
So, it is important to quickly determine if the drop in TTFB is because of a surge in traffic, and if that increase is due to legitimate or illegitimate traffic – such as bots, web crawlers, SEO tools, DDOS, cron activity etc.
For example:
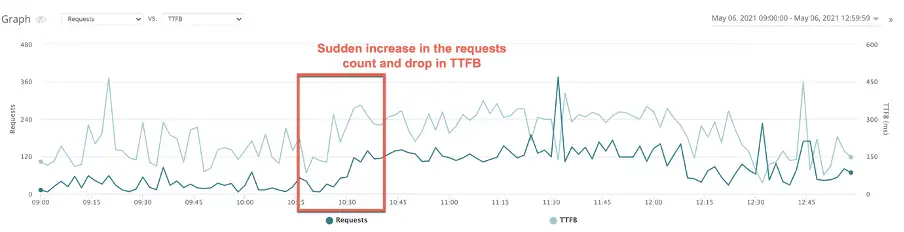
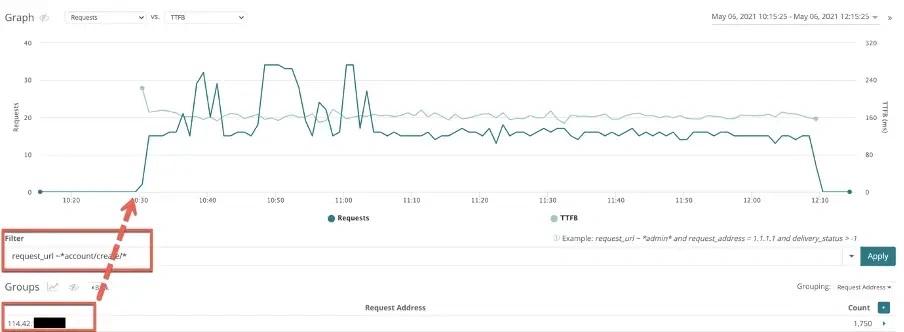
Quick correlation to a bad bot that was attempting to create accounts on this site:
Infrastructure:
There are hundreds of areas that can go wrong and cause an increase in TTFB. The key is to be able to quickly correlate the cause so that the impact can be minimized and mitigated. Let’s take a look at a few examples.
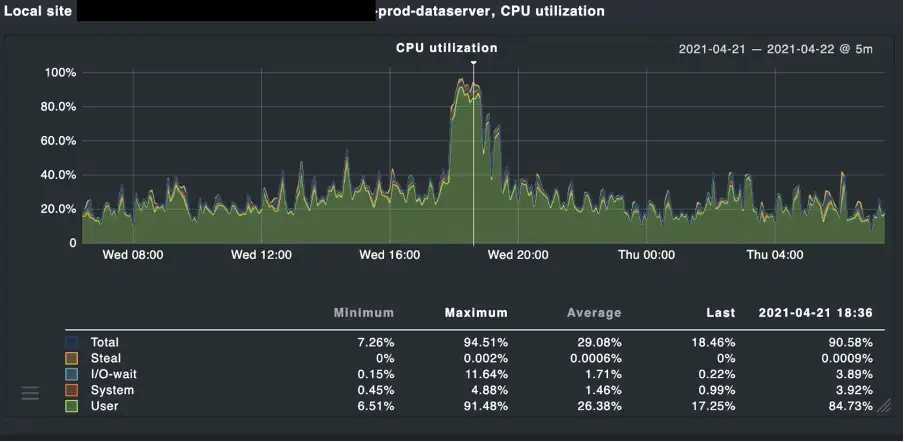
CPU/memory utilization: In the below example we noticed a drop in TTFB which resulted in the end user’s requests being rejected with an HTTP 5xx error.
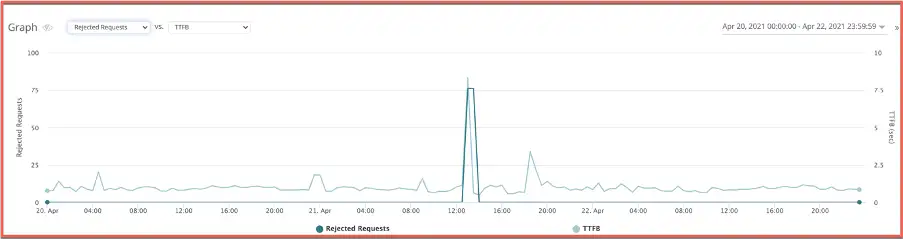
A quick correlation with the infrastructure monitoring helped narrow down the issue to a data server that was experiencing high CPU utilization.
Slow SQL queries: These slow queries can overload the DB and slowdown the website drastically and may even lead to the site going down completely.
For example:
A quick correlation with the infrastructure health pointed to a DB server that was overloaded:

This can happen due to multiple reasons, but the sooner one can pinpoint the area of concern, the faster the resolution. Even if not a permanent solution, there are workarounds that could fix the issue temporarily and bring the site back on track.
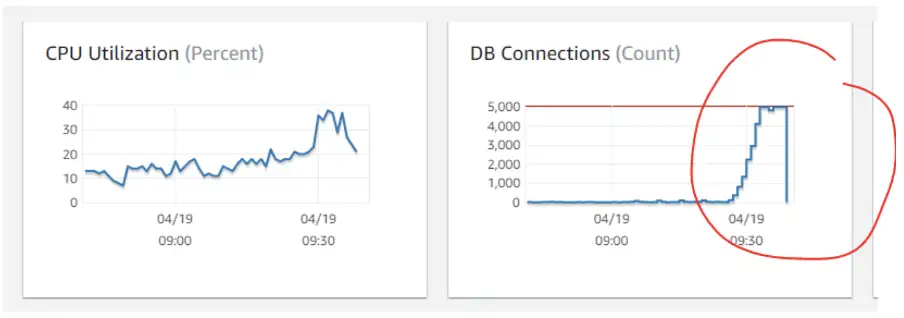
Cron jobs going bonkers: Here is a scenario where batch processing during peak hours caused the DB connections to reach their capacity and cause a slowdown.
There are several other issues that can reflect slow TTFB symptoms, but the ability to quickly correlate is the key to a quick resolution.
- Increase in disk I/O
- Bug in external APIs
- Page renders
- Slow cluster scale out issues
- Code synching issue
- HTML cache issues
- Page config issues
- Code issues
Network:
This is a big blind spot for organizations and often ignored. I call it a blind spot because the network is made up of ISPs (Tier 1, 2 or 3) which are mostly out of the control of an organization.
Most applications are served from one or more CDN. The end user to CDN edge mapping is done by leveraging DNS, and the CDNs themselves have a multi-tier architecture.
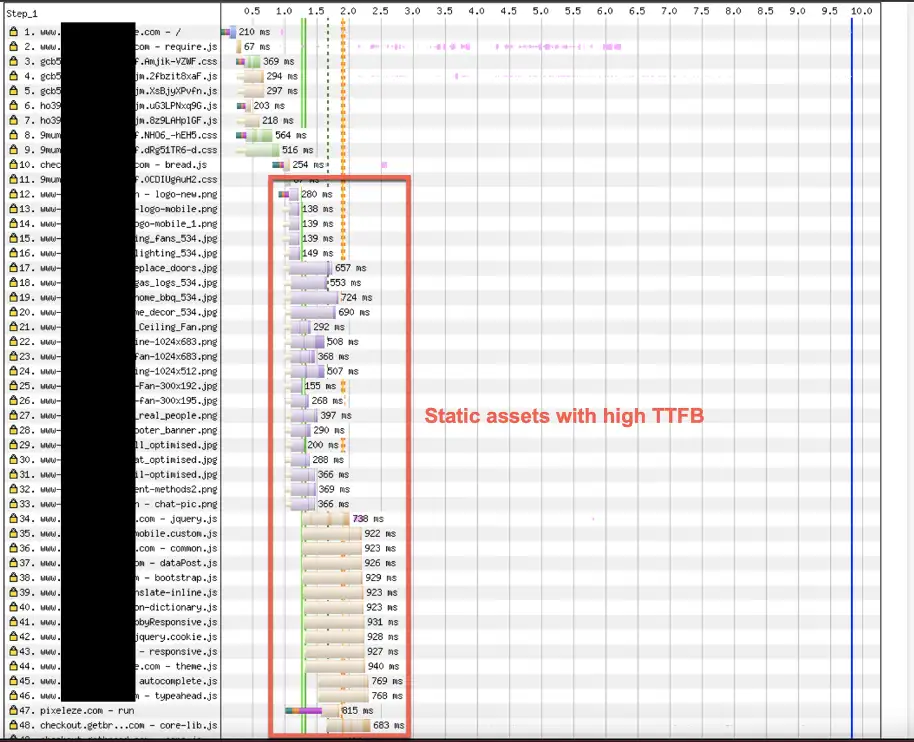
While this looks pretty straightforward in the whitepaper of a CDN, there is a lot of complexity involved and often any inefficiency in this layer is reflected in TTFB slow down.
For example, in the scenario below all the static assets served from a CDN experienced very high TTFB:
My grand dad used to say let me check your pulse and I will tell you if you have a problem. Similarly monitor your TTFB and it will tell you if your application has a problem.
We’d be happy to give your storefront a health check – reach out to us at info@webscale.com and one of our performance specialists will be in touch.


