
In this article, I will walk you through the step-by-step process of diagnosing an increase in the average time to first byte (TTFB) for an application running on the Webscale platform. More specifically, we will use the data available in the Webscale Traffic Viewer to identify a service within the distributed application infrastructure that caused the increase. These investigation techniques are a great example of how you can query the data available within our Traffic Viewer application to narrow the source of a problem within your application.
Every now and then, one of our customers will bring an issue, such as the one I describe here, to my attention. In this case, the user jumped to an erroneous conclusion that the performance issue was within the CDN serving their application, when in fact there was an application issue.
The application that we will explore was deployed using a typical Webscale model with CloudEDGE CDN in front of a scalable ecommerce application. Traffic in this environment first arrives at a CDN PoP within CloudEDGE. On a cache miss, it will be routed towards the origin where the request will leave CloudEDGE, via a Proxy close to the origin, where it will be serviced by an origin application server.

Figure 1: The current standard architecture for Webscale.
While investigating a slowdown the team recognized that there was a noticeable increase in TTFB on the customer application, as measured by a synthetic network monitoring tool. The tool tracks network transit times for resources on a fixed set of application web pages, and the team noticed a sizable discrepancy in the data captured over the last 24 hours. They brought the issue to my attention and we began using our Traffic Viewer tools to verify the slowdown and tease out the source of it. The following is a rough description of our investigation that demonstrates using the Webscale Portal tools to isolate the source of an application issue.
Step 1: Analyzing data on all successful requests in Traffic Viewer
Before looking for the cause of the slowdown, we had to determine whether it was observable in our data. To do this, we began by loading up the CDN traffic logs in the Traffic Viewer for the relevant time period and filtering out records that had a status code other than 200. The resulting data is plotted in the graph of Figure 2. Note that we limited our selection to requests that received a response status code of 200, allowing us to eliminate blocked requests or errors that were unrelated to our performance issue.
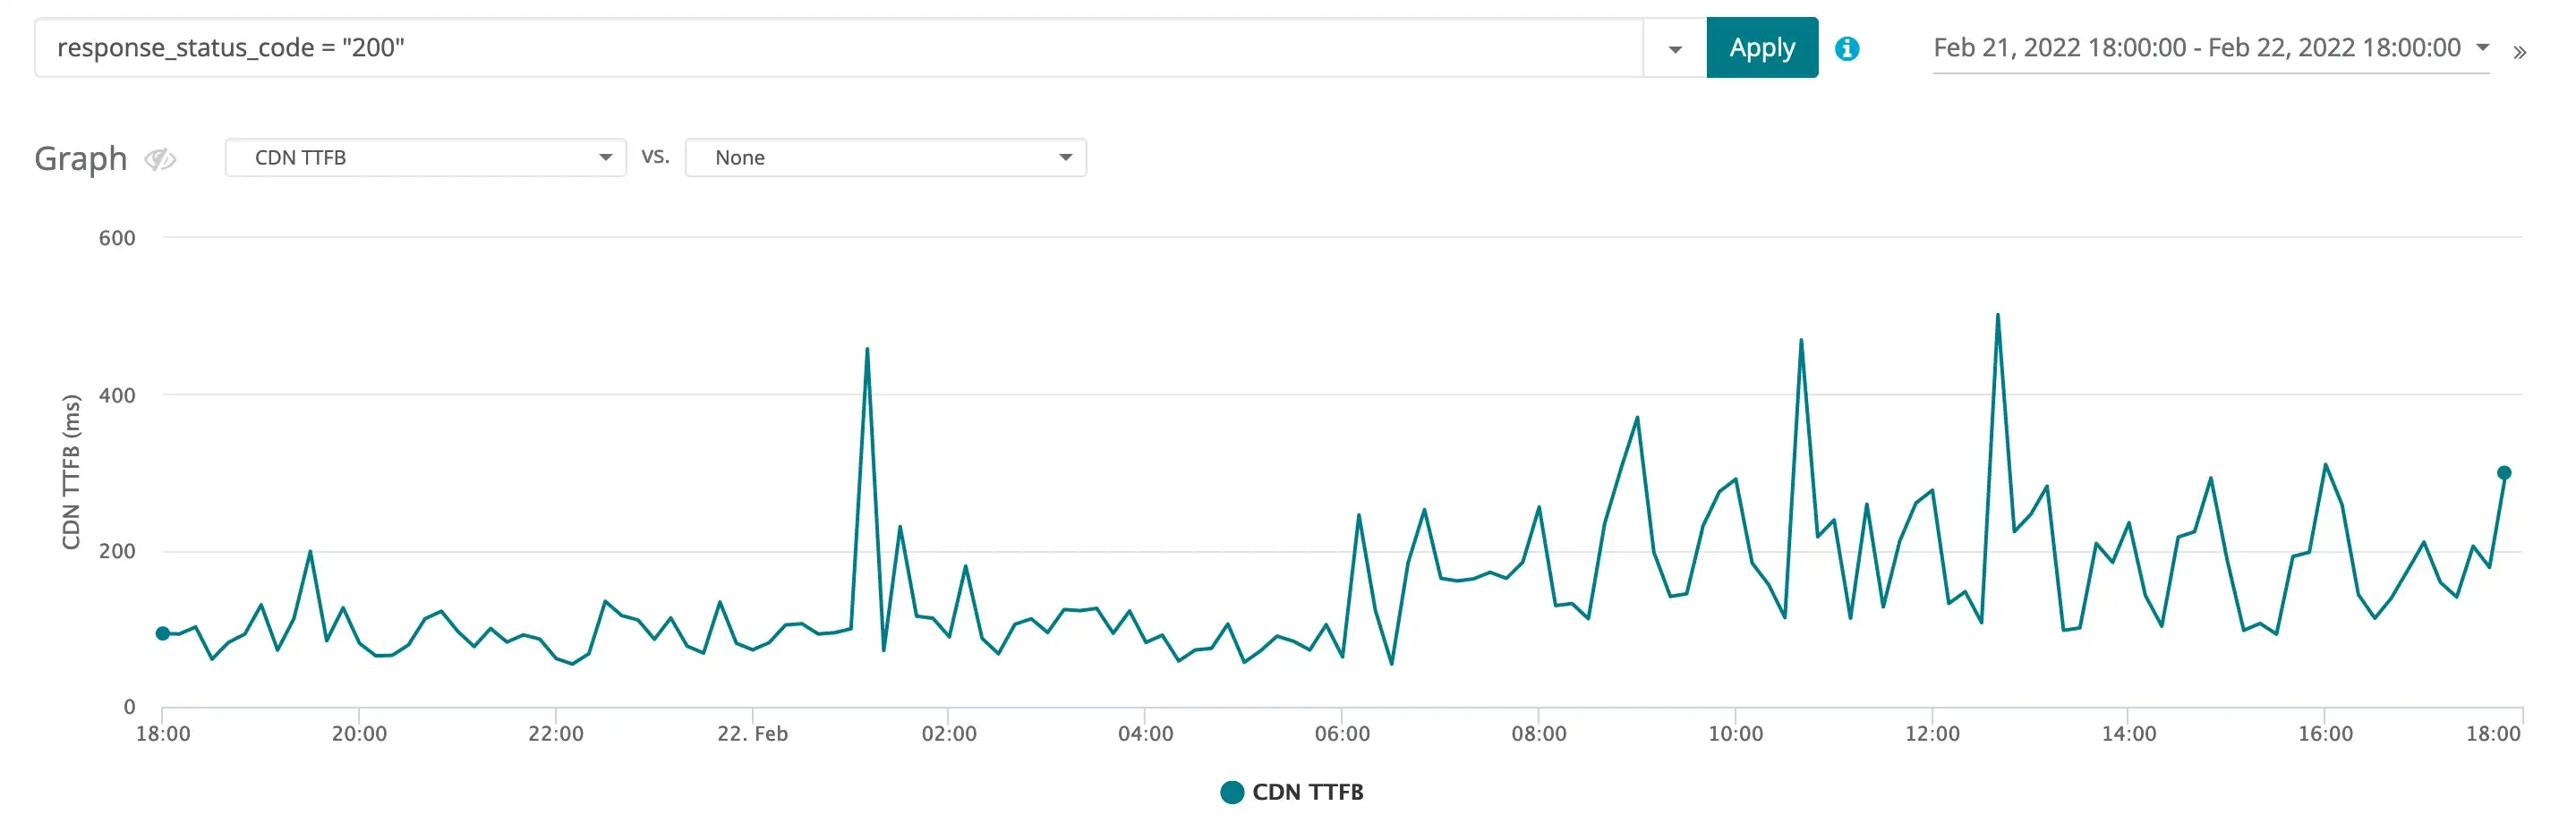
Figure 2: The CDN TTFB metric from the time period when the slowdown began. The center of the graph is where the slowdown started at about 06:00 on February 22nd.
The user believed that there was a CDN issue and we first wanted to verify that in our logs. We can see that at 06:00 on February 22nd there is a noticeable increase in TTFB. From this zoomed-out view inside the CDN logs, we can measure an average TTFB of 104.7 ms before 06:00 on the 22nd, and an average TTFB of 198.3 ms after. So from the CDN logs, it does appear that the CDN performance halved during this time period. While 100ms may sound small, it is not. Recall that this includes data for all requests serviced by the CDN at this time, including a large number of requests that only take a few milliseconds to complete. But we need to look more closely at all of the data available to understand exactly what is slowing the application down.
Step 2: Deep dive into CDN-cached request data using Traffic Viewer
For this application, requests can be divided into two primary buckets from the CDN perspective—requests that are cached at the CDN and requests that are not cached at the CDN. In this case, we have two cache behaviors configured on our application, one for requests with paths that start with “/media” and one for those that start with “/static.” All other requests to the CDN are guaranteed cache misses that will be routed to origin for processing. If we limit our data view to just static and media requests with a 200 status code, then we get the graph shown in Figure 3.
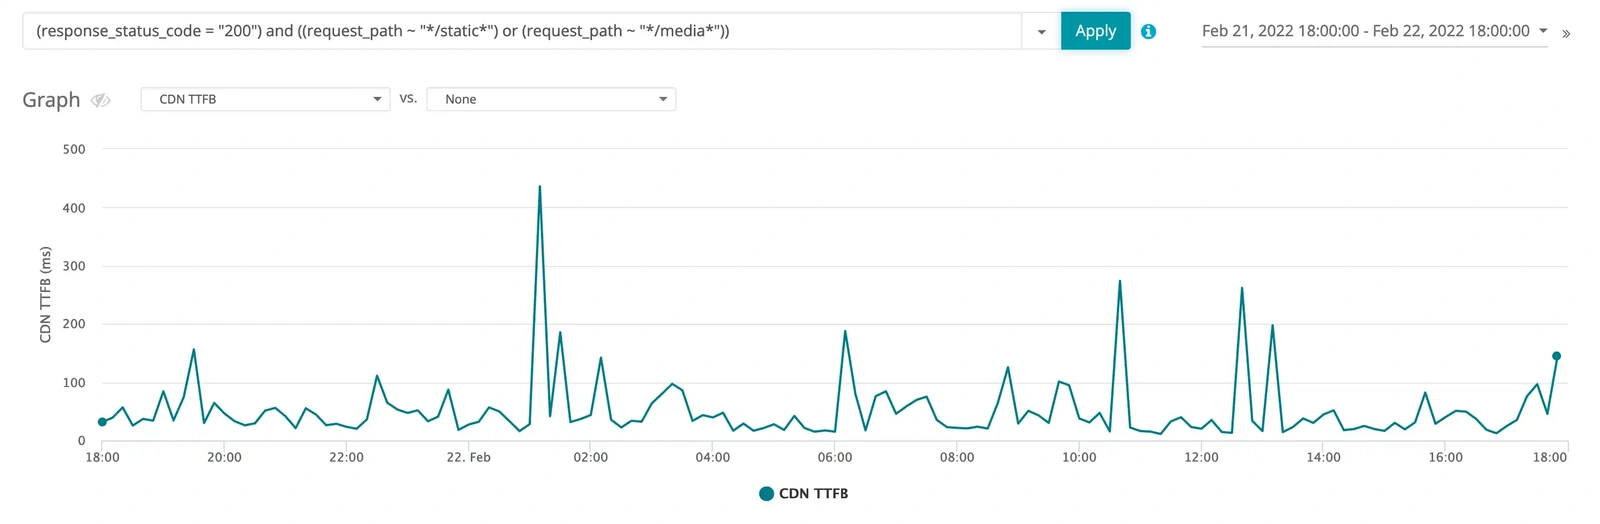
Figure 3: The CDN TTFB metric from the time period when the slowdown began but limited to only requests that match request_status_code = 200 and ((request_path ~ /static*) or (request_path ~ /media*)). Nothing really interesting to see here, before and after the event cache performance looks pretty much the same.
Notice that the increase we initially observed in the CDN logs is no longer apparent in Figure 3. From the figure, we can see that the CDN cache performance before and after 06:00 was approximately the same. Thus, we can rule out the CDN cached requests as the potential root cause and start investigating the uncached requests.
Step 3: Excluding CDN-cached requests from the dataset in Traffic Viewer
Let’s instead plot the opposite data, so requests that had a 200 status code but were neither media nor static assets. These results are in Figure 4.
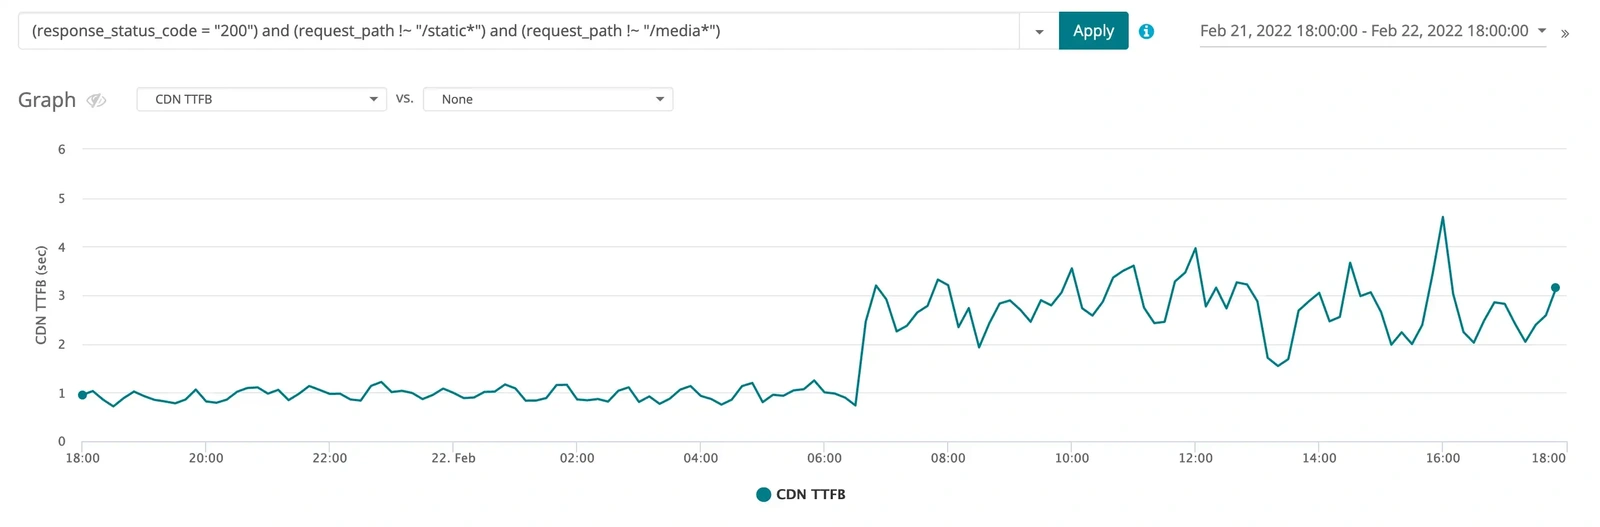
Figure 4: The CDN TTFB metric from the time period when the slowdown began but without considering static assets or media, i.e., filtered with response_status_code = 200 and request_path !~ /static* and request_path !~ /media*.
Now this is interesting. We can clearly see that the slowdown is real and does not involve cached assets at the CDN. The graph in Figure 4 only plots requests that returned a status code 200 and were not cacheable at the CDN and we can see that at approximately 06:00 on Feb 22 non-cacheable requests significantly slowed down.
Step 4: Identifying an individual problematic request in the CDN log
Now, let’s identify a specific slow request from this data, and then track it through the proxy logs to try and identify the source of the slowdown. Figure 5 has the details of a single request for the homepage of this site, that is in our data set, which had a TTFB of 4212 ms or well within the slowdown period.

Figure 5: Details of a request from the CDN log that experienced the slowdown.
Right-clicking on the request, we can access the Show details popup menu item that will give us more detail on the request.
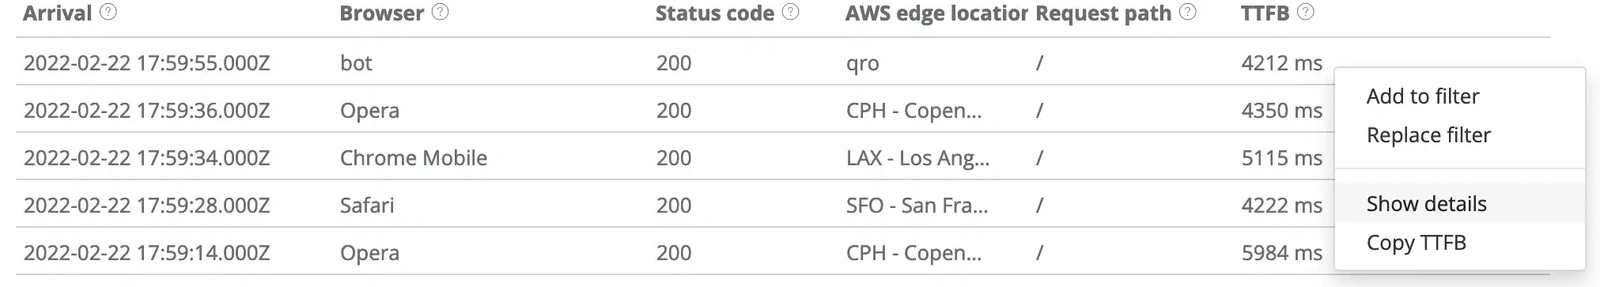
Figure 6: How to navigate to Show details.
Specifically, we’re looking for the request_id. It’s important to know that a unique request_id is assigned to each request that arrives at the Webscale data plane and that, as that request traverses the system, its request_id will not change. This means that we can copy the request_id from the details of the CDN request log and search for that request in the proxy log. Recall that if the request is a miss against the CDN cache then, in this application, the request will egress to origin through a proxy that will log its handling.
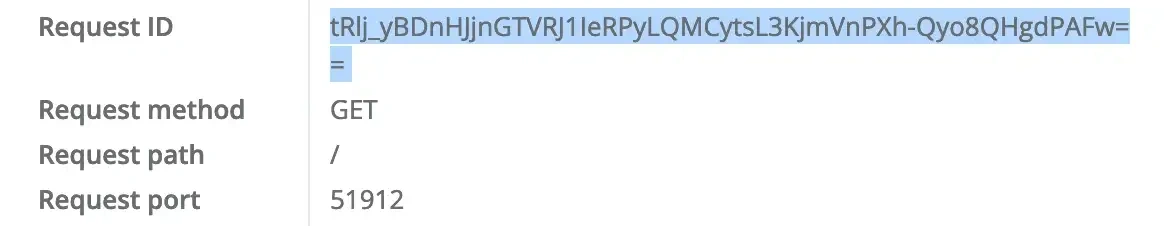
Figure 7: In Show Details, scroll down to find the Request ID.
With this request_id, we can switch from the CDN logs to the proxy logs to see where the slowdown might have occurred.
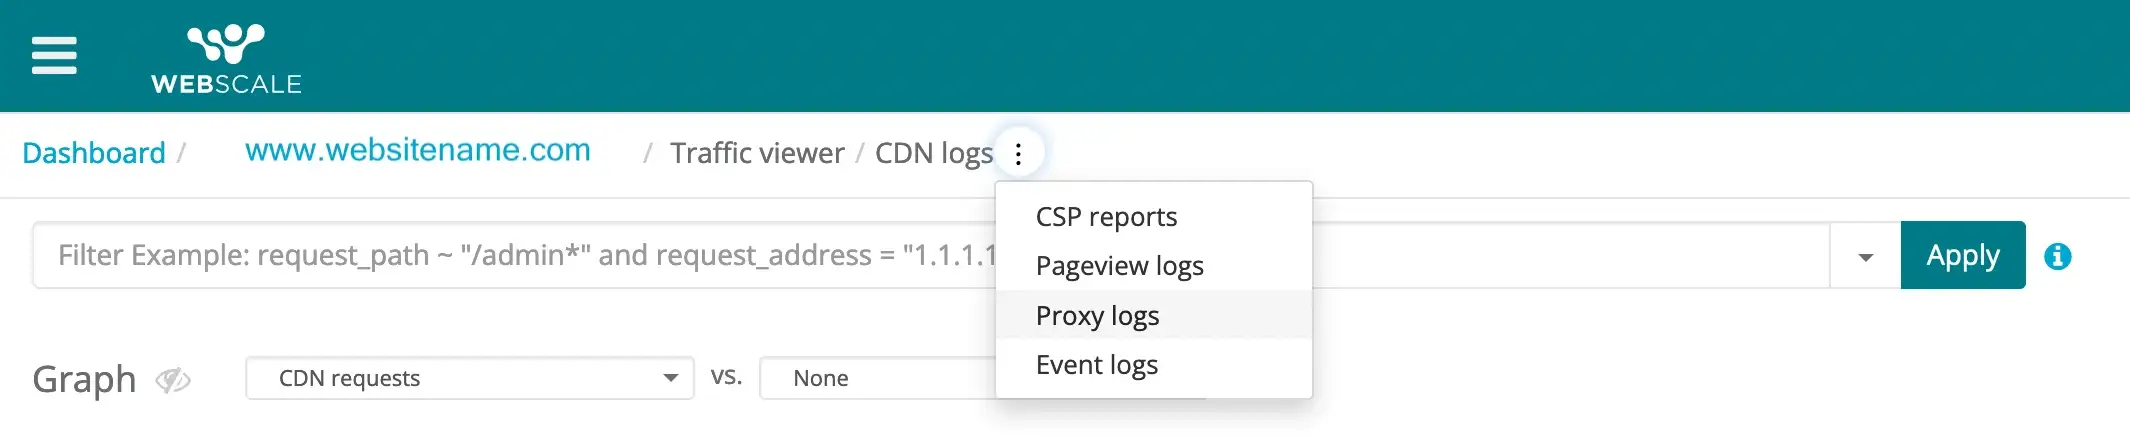
Figure 8: How to navigate from CDN logs to proxy logs.
Step 5: Locating and investigating the problematic request in the proxy logs
Looking in the proxy logs, we filter on this request_id and find the exact record that we are interested in, as seen in Figure 5.
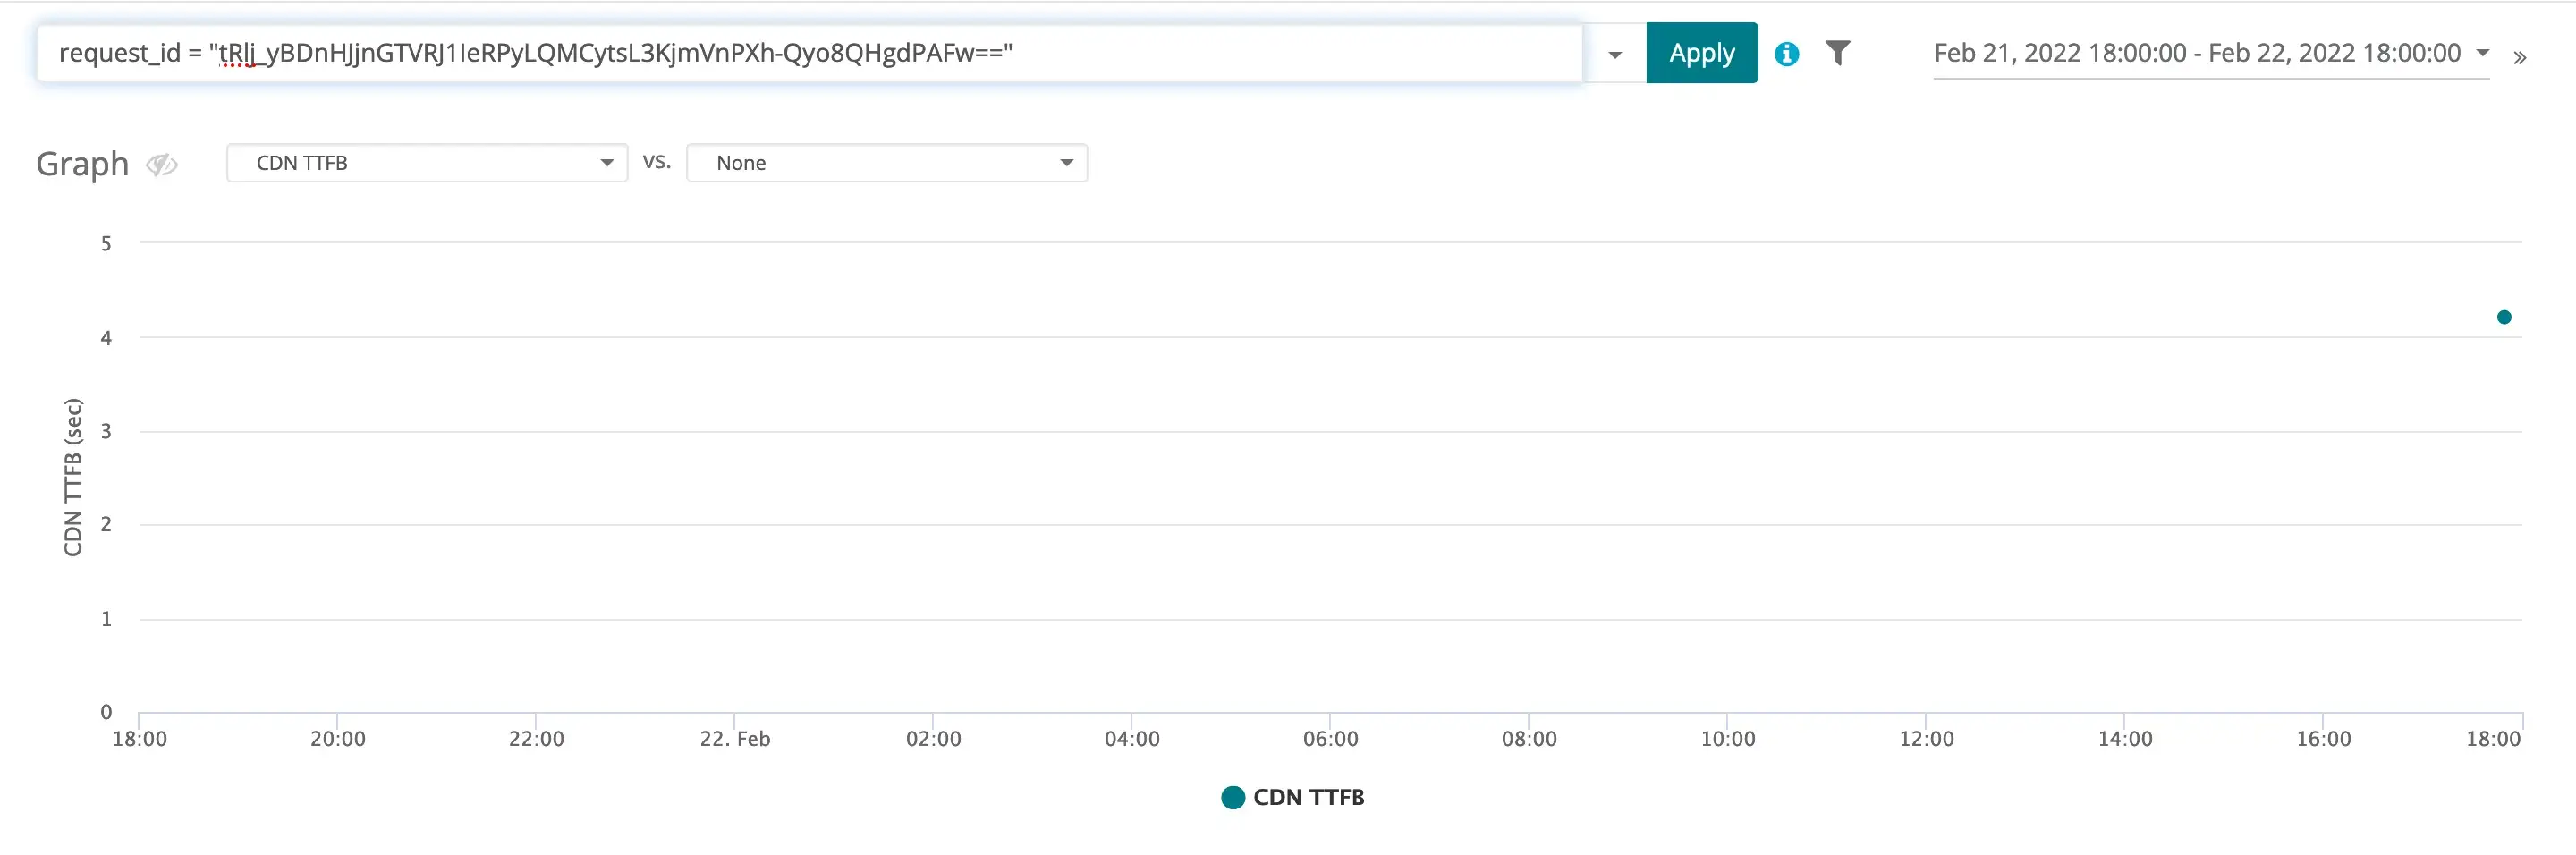
Figure 9: The proxy log record for the request matching the request_id taken from the CDN logs.
Looking a little deeper, we can see details of the request that was processed. In this case, we’re very interested in the server latency, a measure of the time it took the origin server to process this request.

Figure 10: Details of a request from the proxy log that experienced the slowdown.
From the data, we can see that this request took the origin server about 4015 ms to process with no queue latency. This is important because we now know that the slowdown is related to the origin request handling and not anything in the Webscale data plane. Now we are confident that something must have happened to the application at this time.
Step 6: Correlating the findings with data in the Events logs
Let’s check to see if there is an event that has more data on the issue in the events logs. In Figure 6, we can see that a severe event did occur at the same time the application origin slowed down.
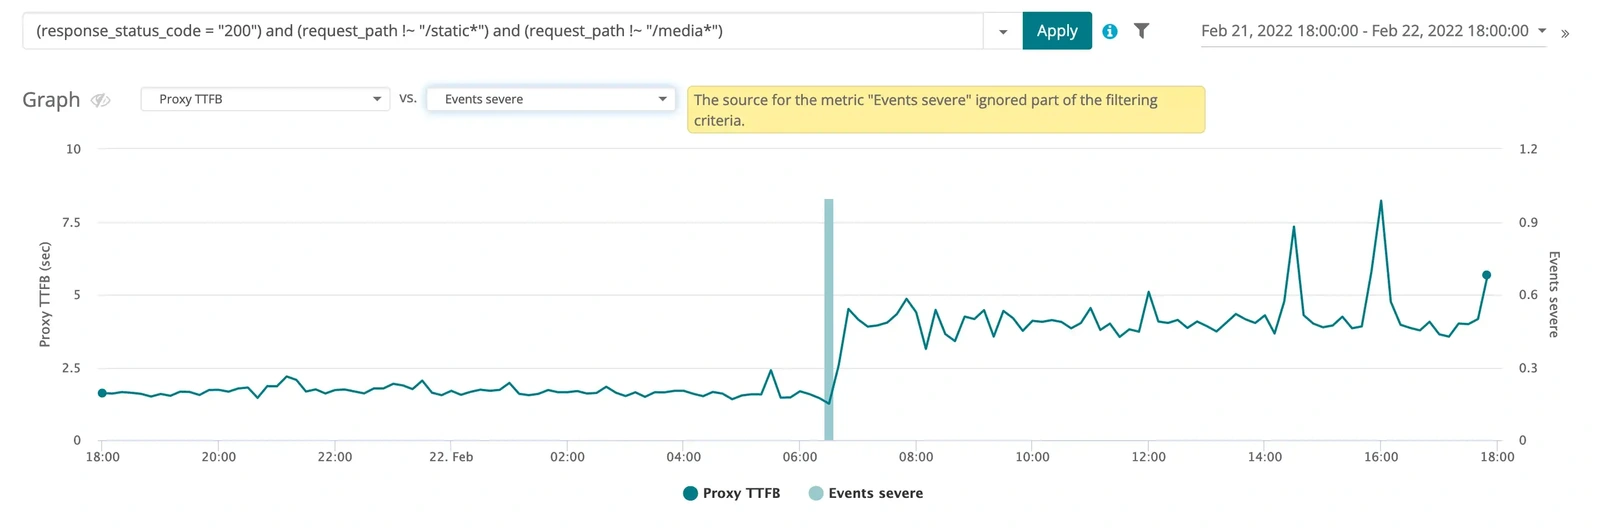
Figure 11: Comparing proxy TTFB data for successful homepage requests like our identified record as compared to severe events that have occurred within the application during this time period.
From the event details in the log, we can see that a 500 status code was received from the application, to our synthetic application monitor at that time.
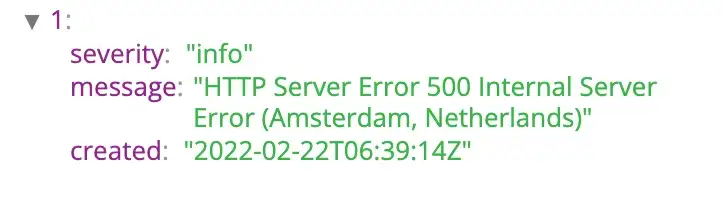
Figure 12: Details of the event that caused the slowdown.
The recorded 500 status code indicates an internal application error occurred which is often correlated with an application deployment, where the deployment engineer did not flush the internal application cache.
Step 7: Communicating the findings to the application developer
At this point, we would begin working with the developer to understand what changes occurred in the application at this time, because one of these changes likely caused a degradation in the performance of HTML rendering in the application.
Through this investigation, we were able to use our Portal tools to quickly isolate a possible performance issue and to confidently associate it with the responsible system. Further, we were able to isolate the approximate time of the change and when it began impacting customers on the application. In this case, we helped our user get clear on where in the system they should be looking for the issue. This saved them time which they otherwise would waste on investigating the wrong service. You can use the same methodology to speed up your own root cause analysis of similar issues. For more information about using Webscale Traffic Viewer, visit our Knowledge Base.


