


Chart.js is an open-source HTML5 based JavaScript library for rendering charts in HTML5 canvas. With Chart.js, you can visualize the data using several plots like line, bar, scatter, and so on.
There are several libraries out there for data visualization, such as Django Highcharts and Plotly.js.
Why Chart.js?
Chart.js is quite flexible and easy to set up. Plus, you get to choose from about eight different chart types. This project has over 55K stars on GitHub. Developers prefer Chart.js over other libraries because:
- Charts are animated.
- Charts are customizable.
- Chart.js contains several extensions for improving the interactivity.
In this tutorial, we’ll be looking at how to integrate Chart.js in Django by building a simple project.
Prerequisites
To follow along with this tutorial, you’ll need Python3 installed on your machine.
A little understanding of Django would help the reader follow along better.
To understand more about Django, it is recommended to read these articles on Django CRUD APIs and Django API documentation.
Creating and setting up a new Django project
Let’s start by creating a new virtual environment.
A virtual environment allows you to create a virtual space on your computer.
By creating a virtual environment, you’ll be able to separate the necessary library installation for a project without having to install them globally.
Now, create a virtual environment env by running the command below:
python -m venv env
Here, we tell Python to create the virtual environment in a folder named env in the current directory.
On creation, activate the virtual environment using the following command:
source env/bin/activate
On activating the environment, install Django using the following command:
pip install django
Now, let’s create a new Django project Django-charts using:
django-admin startproject Django-charts
Then, navigate to the Django-charts directory and create a Django app:
cd Django-charts
django-admin startapp charts
Let’s add our app to the list of already installed apps.
Navigate to the Django-charts directory and edit the settings.py file:
INSTALLED_APPS = [
    'django.contrib.admin',
    'django.contrib.auth',
    'django.contrib.contenttypes',
    'django.contrib.sessions',
    'django.contrib.messages',
    'django.contrib.staticfiles',
    'editors',
]
Creating a model
A model in Django is a class that represents a single table or a database. It can be used to dynamically load data into a project.
Here, in this tutorial, we’ll be learning how to create a chart that visualizes the trends in usage for different text editors.
For our model, we’ll be creating two fields: user field num_users and text editor field editor_name.
Under the editors directory, copy and paste the following code in the models.py file:
from django.db import models

#defining a simple class
class Editors(models.Model):
    editor_name = models.CharField(max_length=200)
    num_users = models.IntegerField()

    def __str__(self):
        return "{}-{}".format(self.editor_name, self.num_users)
Now, let’s register the model Editors in the admin.py file so that we can modify it in the Django admin section.
from django.contrib import admin
from .models import Editors

admin.site.register(Editors)
Next, we need to migrate our model to the database.
Migrations are Django’s way of publishing changes you made to your models into the database schema. So, when creating a new model, we migrate to create the required table in the database.
Next, we migrate our model by running the commands below:
python manage.py makemigrations # migrating the app and database changes
python manage.py migrate        # final migrations
A superuser has the permissions to create, edit, update and delete data in Django admin.
Create a superuser by running the command below:
python manage.py createsuperuser
Now, we can log in to the admin page.
To login to the admin section, serve the app again, go to http://localhost:8000/admin, and log in with your superuser credentials.
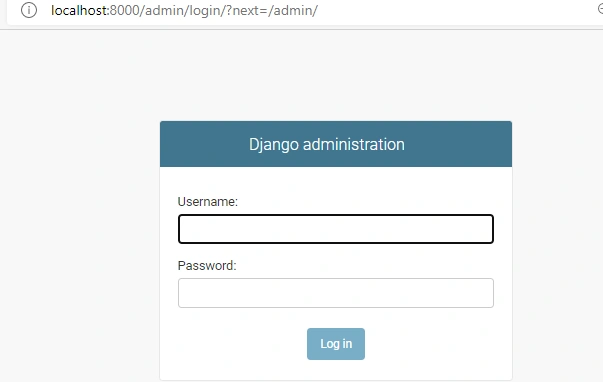
Django admin login page
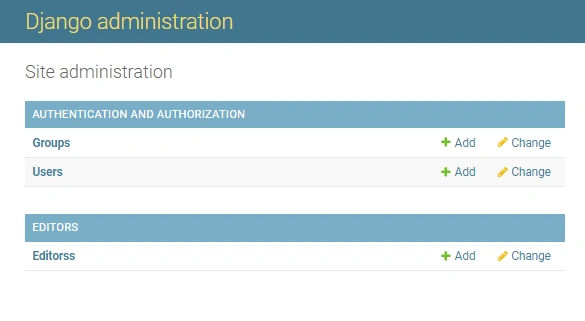
Django admin page
Now, let’s add an editor in the Editors category, to test if it’s error-free.
Click on the editor, then click Add Editor to add an editor.
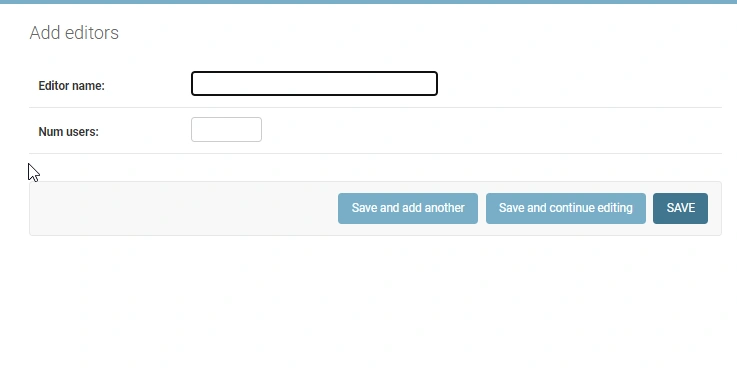
Add editor
Creating a view
A view in Django is basically a function that accepts a web request and returns a web response.
A web response can be an error page, redirect, image, or even HTML content.
Now, let’s create a view by adding the following to our view.py file:
from django.shortcuts import render
from django.views.generic import TemplateView
from .models import Editors

# Creating views
class EditorChartView(TemplateView):
    template_name = 'editors/chart.html'

    def get_context_data(self, **kwargs):
        context = super().get_context_data(**kwargs)
        context["qs"] = Editors.objects.all()
        return context
We do not have our chart.html file created yet.
Let’s create that by creating a templates folder in our editors directory. The file directory should look like templates/editors/chart.html.
Creating templates
We start by creating a templates directory in our base directory. This templates directory will house our base.html file.
base.html is basically the skeleton for all pages in the application.
We should have something like this: django-charts/templates/base.html.
Next, we add the following lines of code to the base.html file.
<!doctype html>
<html lang="en">
  <head>
    <meta charset="utf-8">
    <meta name="viewport" content="width=device-width, initial-scale=1, shrink-to-fit=no">
    <!--Chart js-->
    <script src="https://cdnjs.cloudflare.com/ajax/libs/Chart.js/2.8.0/Chart.min.js" integrity="sha256-Uv9BNBucvCPipKQ2NS9wYpJmi8DTOEfTA/nH2aoJALw=" crossorigin="anonymous"></script>
    <link rel="stylesheet" href="https://cdnjs.cloudflare.com/ajax/libs/Chart.js/2.8.0/Chart.min.css" integrity="sha256-aa0xaJgmK/X74WM224KMQeNQC2xYKwlAt08oZqjeF0E=" crossorigin="anonymous" />
    <!-- jQuery -->
    <script src="https://code.jquery.com/jquery-3.3.1.min.js"></script>

    <title>Text-Editor/IDE Charts</title>
  </head>
  <body>
   {%block scripts%}
   {%endblock scripts%}

   {%block content%}
   {%endblock content%}

  </body>
</html>
Next, we need to update the DIRS to the path of the templates folder in our settings.py file.
TEMPLATES = [
    {
        'BACKEND': 'django.template.backends.django.DjangoTemplates',
        'DIRS': [os.path.join(BASE_DIR, 'templates')],
        'APP_DIRS': True,
        'OPTIONS': {
            'context_processors': [
                'django.template.context_processors.debug',
                'django.template.context_processors.request',
                'django.contrib.auth.context_processors.auth',
                'django.contrib.messages.context_processors.messages',
            ],
        },
    },
]
Now, open up the chart.html file that we created earlier and add the following code:
{% extends 'base.html'%}

{%block scripts%}
<script>
// jquery function
$(document).ready(function(){
        var ctx = document.getElementById('myChart').getContext('2d');
        var myChart = new Chart(ctx, {
            type: 'doughnut',
            data: {
                labels: [{%for data in qs%}'{{data.editor_name}}',{%endfor%}] //loop through queryset,
                datasets: [{
                    label: '# of users',
                    data: [{%for data in qs%}{{data.num_users}},{%endfor%}],
                    backgroundColor: [
                        'rgba(255, 99, 132, 0.2)',
                        'rgba(54, 162, 235, 0.2)',
                        'rgba(255, 206, 86, 0.2)',
                        'rgba(75, 192, 192, 0.2)',
                        'rgba(153, 102, 255, 0.2)',
                        'rgba(255, 159, 64, 0.2)'
                    ],
                    borderColor: [
                        'rgba(255, 99, 132, 1)',
                        'rgba(54, 162, 235, 1)',
                        'rgba(255, 206, 86, 1)',
                        'rgba(75, 192, 192, 1)',
                        'rgba(153, 102, 255, 1)',
                        'rgba(255, 159, 64, 1)'
                    ],
                    borderWidth: 1
                }]
            },
            options: {
                scales: {
                    y: {
                        beginAtZero: true
                    }
                }
            }
});
    });
</script>
{%endblock scripts%}

{%block content%}
<!-- displaying the chart -->
<!-- you can also play around with the width and height to increase or decrease the chart size -->
<canvas id="myChart" width="400" height="100"></canvas>
{%endblock content%}
In the above code, we are substituting the sample data with data being passed from the backend.
Next, we edit our urls.py by adding the following code:
from django.contrib import admin
from django.urls import path
from editors.views import EditorChartView

urlpatterns = [
    path('admin/', admin.site.urls),
    path('', EditorChartView.as_view(), name='index')
]
Now, let’s add a few text editors and some users to our Django admin.
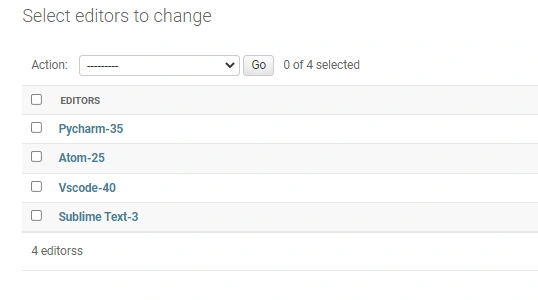
Adding new text editors
Let’s test this out by starting the server with the following command:
python manage.py runserver
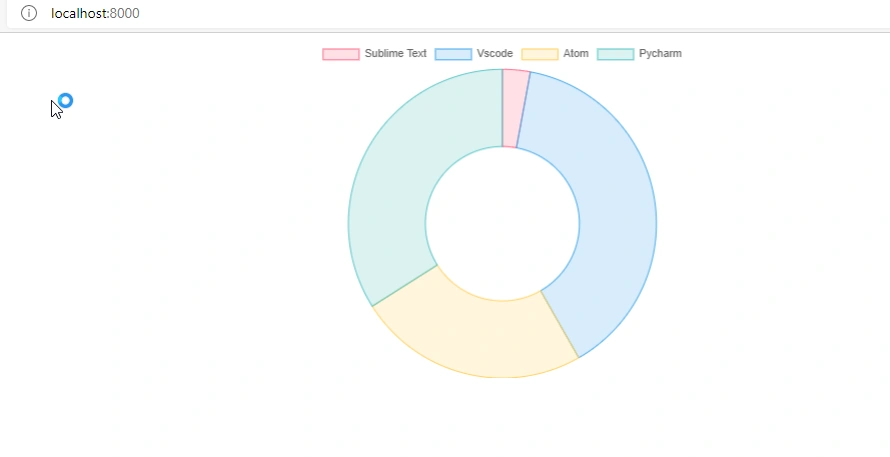
Display pie chart
Conclusion
To conclude, we have learned about Chart.js. We have also learned how to integrate charts in a Django app.
In this tutorial, we learned how to use doughnut chart type. There are other chart types you can use.
You can also check the Chart.js documentation for more info on the chart types.
You can check out the full code on GitHub.
Happy coding!


Comments: