


Graphs are mathematical structures that reflect the pairwise relationship between things. A graph is a type of flow structure that displays the interactions of several objects. It may be represented by utilizing the two fundamental components, nodes and edges.
- Nodes: These are the most crucial elements of every graph. Edges are used to represent node connections. For example, a graph with two nodes connected using an undirected edge shows a bi-directional connection between those two nodes.
- Edges: Edges are part of a graph showing the connections between nodes. An edge represents the connection between two nodes.
An application in real life
- Google Maps: link your journey from the start to the end.
- Social Networks: friends are connected with each other using an edge where each user represents a vertex.
- Recommendation System: relationship data between user’s recommendations uses graphs for connection.
Type of graphs
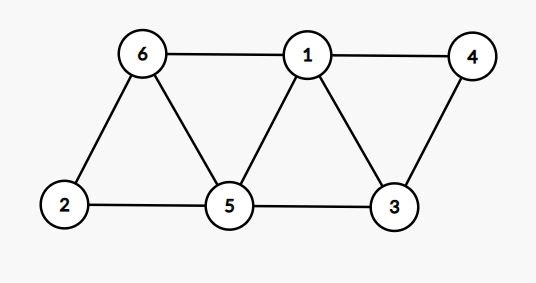
- Undirected: All edges in an undirected graph are bidirectional and do not point in any particular direction.
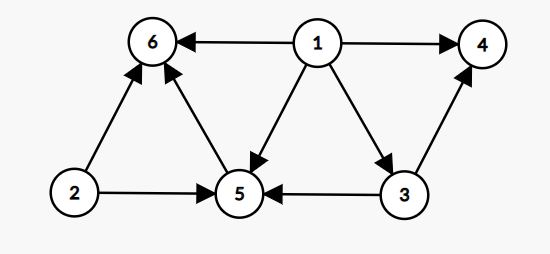
- Directed: In a directed graph, all edges are unidirectional; they point in a single direction.
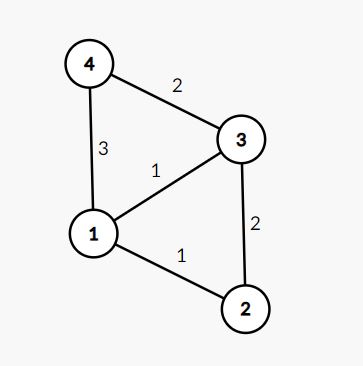
- Weighted: Weighted graph, with each edge, allocated a weight or cost. Consider a network with four nodes, shown in the picture. Every edge of a graph has some weight with it.
If you wish to get from vertex 2 to vertex 1, you can choose one of three routes:
2->3->1
2->1
2->3->4->1
As a result, the total cost of each path is as follows:
The total cost of 2->3->1 is (2+1), or three units.

The total cost of getting from 2->1 is one unit.

The total cost of 2->3->4->1 is (2+2+3), or seven units.
- Cyclic: If a graph contains a path that starts and finishes at the same vertex, it is said to be cyclic. This is referred to as a cycle. An acyclic graph does not have a cycle.
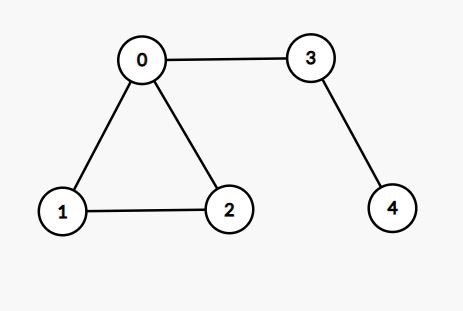
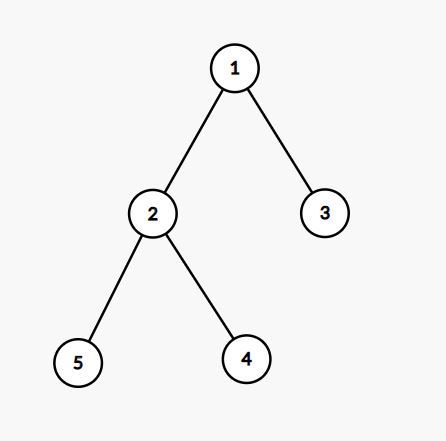
The diagram below depicts a cycle (0->1->2). A tree is a graph that has just one path connecting any two vertices. Every node in a graph may have one or more parents. In a tree as each node has precisely one parent node.
A tree cannot have any loops or cycles, whereas graphs may.
Graph representation
We can represent a graph in several ways.
The following are the two most frequent ways of expressing a graph:
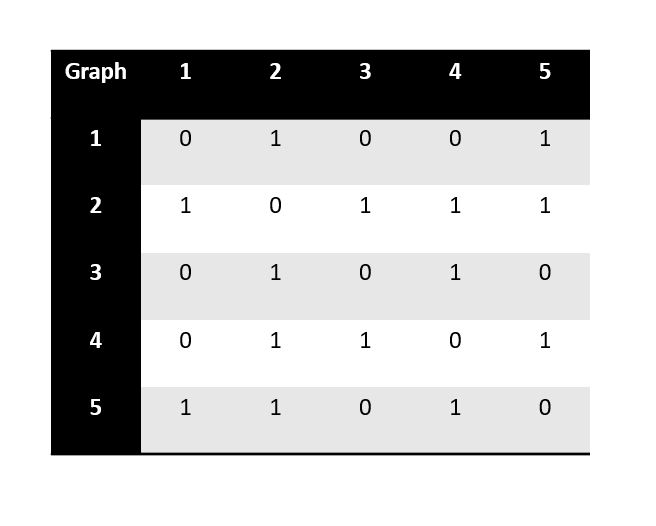
- Adjacency Matrix A V*V binary matrix is an adjacency matrix. There is an edge that is connecting vertex i and vertex j, element Ai,j is 1, otherwise Ai,j is 0.
Note: A binary matrix has cells that can only have one of two possible values: 0 or 1.
We can store the cost of the edge at Ai,j in the adjacency matrix of a weighted graph rather than storing 0 or 1.
If Ai,j is 1 in the undirected graph then Ai,j will also be 1.
If Ai,j is 1 in the directed graph, then it may or may not be 1.
The adjacency matrix offers constant-time access (O(1)) to detect if two nodes have an edge. Therefore, the adjacency matrix has a space complexity of O(V)2.
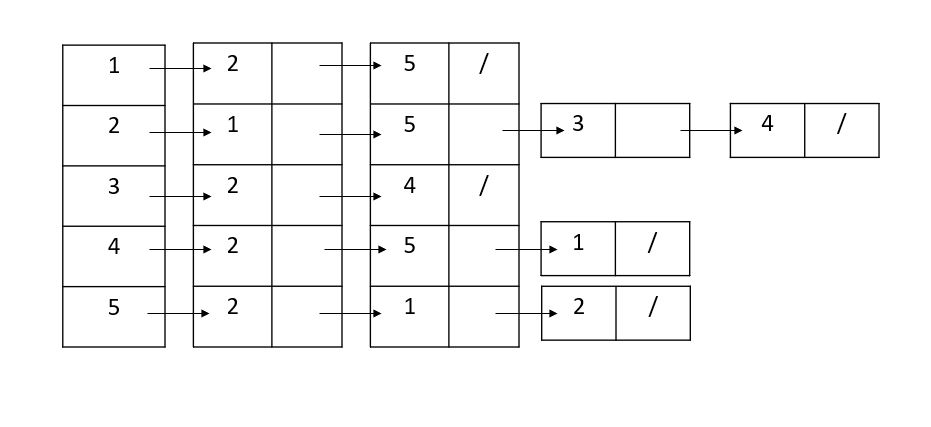
- Adjacency List This is the most common way of representing a graph when we implement it in our code. An adjacency list is a collection of distinct lists in an array A. For example, every node of a graph Ai is a list that holds all the vertices’ values next to vertex i.
If we have a weighted graph, we store the cost with the vertex using pairs. You will get a better understanding when we implement it in our code. If vertex j is in list Ai, vertex i will be in list Aj in an undirected graph.
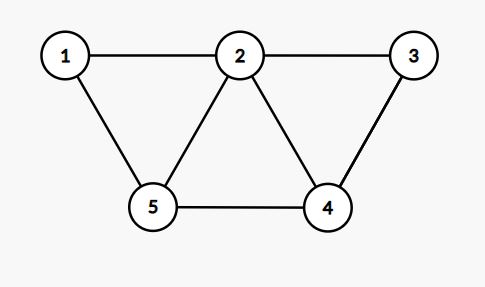
Since that information in the adjacency list is only stored for edges that exist in the graph, its space complexity is O(V + E). Representation of an undirected graph,
- G is an undirected graph with 5 vertices and 7 edges.
- Adjacency-list representation of G.
- The adjacency-matrix representation of G.
Code for Adjacency list representation of a graph
#include <iostream>
#include<list>
using namespace std;

class graph{
public:
    list<int> *adjlist;
    int n;
    graph(int v){
        adjlist=new list<int> [v];
        n=v;
    }

    void addedge(int u,int v,bool bi){
        adjlist[u].push_back(v);
        if(bi){
            adjlist[v].push_back(u);
        }
    }

    void print(){
        for(int i=0;i<n;i++){
            cout<<i<<"-->";
            for(auto it:adjlist[i]){
                cout<<it<<" ";
            }
            cout<<endl;
        }
        cout<<endl;
    }


};

int main() {
    graph g(5);
    g.addedge(1,2,true);
    g.addedge(4,2,true);
    g.addedge(1,3,true);
    g.addedge(4,3,true);
    g.addedge(1,4,true);

    g.print();
}
You can find the complete execution of the above code here.
Output
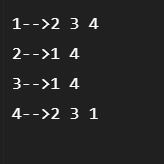
- In the output, you can see the implementation of graphs in the adjacency list view.
Conclusion
By learning graphs from the basics you will think more analytically while solving data structures questions. Next steps now, would be to practice some of the graphs questions, since we now have a better understanding with the foundation of graphs.
Resources
Happy coding!


Comments: