
15 years ago, a typical website’s infrastructure looked pretty simple. But a lot has changed, and hosting architectures today are continuing to increase in complexity.
What used to be a static website occasionally coupled with a content delivery network (CDN) for better performance, has now turned into a combination of:
- A responsive website capable of delivering static, dynamic and interactive content, for great user experiences across all devices, including smartphones, tablets, and smartwatches
- Hosting services from either a traditional vendor (dedicated hosting) or a hyperscale cloud provider, like Amazon Web Services, Google Cloud Platform, or Microsoft Azure
- Content Delivery Network (CDN) and Application Delivery Controller (ADC) services to enhance site availability and improve page load speeds
- Some form of auto-scaling to ensure consistent uptime during unpredictable traffic surges (during peak sale events or aggressive marketing promotions)
- A security stack to protect the website and its users from hackers trying to steal confidential data (such as identities and credit card details)
It’s no surprise then that most small and mid-sized digital businesses, both e-commerce and enterprise, find it challenging to manage this complexity.
You can’t control what you can’t see.
Every website needs an intelligent visibility tool that provides insight into the health of the digital business (traffic, sources, conversions, etc.), hosting infrastructure, and user experience.
There are many tools that will accomplish the former objective – the most popular being Google Analytics. However, few visibility solutions can claim to offer a comprehensive view into a website’s infrastructure and user experience – which includes everything from event logs to uptime, performance, and security.
A window into your website hosting infrastructure and user experience
One of the most valuable components of Webscale’s fully managed hosting plans is our portal – a single pane of glass view that provides end-to-end, real-time visibility into your website hosting infrastructure and user experience.
Here are 6 ways our visibility and control portal empowers our customers:
1. High-level overview of uptime, sessions, and outstanding issues
A high-level, executive (CIO, VP, or Director level) dashboard is the first screen that customers see when they log in to the portal. Here, you have some key performance indicators (KPIs) – page views, sessions, uptime, number of outstanding support tickets, and events data – that provide a quick look at overall application health and status, traffic metrics, and number of unresolved issues.
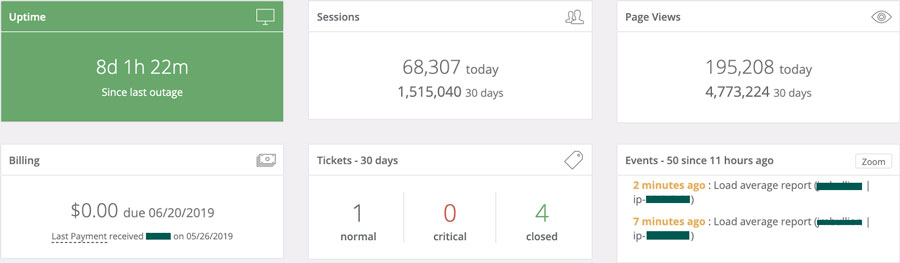
Below this, customers can look at server information and status for each application, along with server scaling and cache details.
2. A comprehensive understanding of website traffic
The traffic portal allows site administrators to measure, monitor, and categorize website traffic. You can identify which countries or regions contribute the most traffic, which can help you potentially identify new promising markets and opportunities.
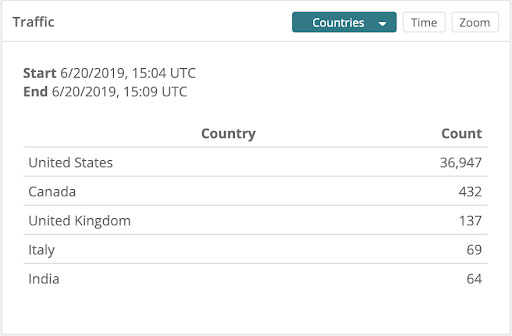
For example, you can analyze your traffic over a month, and identify traffic trends over, say, the holiday season, or during a promotion or sale. This, in turn, can help you get more accurate ROI numbers for the effectiveness of your marketing.
The traffic portal is a great health check for your website with regards to what kind of traffic you’re attracting, and where that traffic is coming from (country, IP address, etc.). It also helps you understand your customer base, which pages they are looking at most frequently, your conversion rates, and much more.
Furthermore, you can use some of this information to proactively identify and troubleshoot issues. For example, if you see a large amount of traffic suddenly (and unusually) coming from a geography that you don’t sell to, it could indicate the onset of a DDoS attack.

Our portal also gives you visibility into the amount of traffic originating from different end user devices and browsers, as well as traffic composed of bots versus real human visitors.
3. Granular insight into all website events
The events section shows everything that happens on your website backend – scale out events, server usage, cache flushes, response time increases/decreases, administrator activity, etc. It’s a near real-time log, updated every five minutes, that contains a great deal of in-depth information.
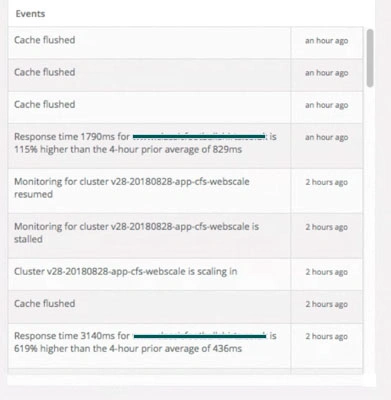
The events section is one of the most powerful tools we provide to troubleshoot your site. The audit log allows you to monitor and track activities, who has accessed the site, and what they did when they were there. As our CTO wisely said, “people break stuff”, and it often happens when a large number of people are working on a website’s code. This tool is the fastest way to identify these problems and resolve them.
This section also indicates if the website’s backup is being taken consistently, which is crucial when a rollback is required.
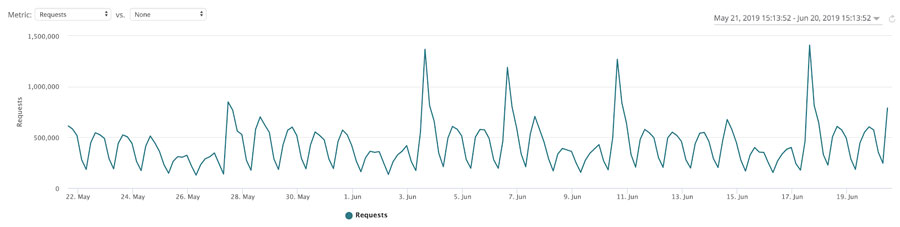
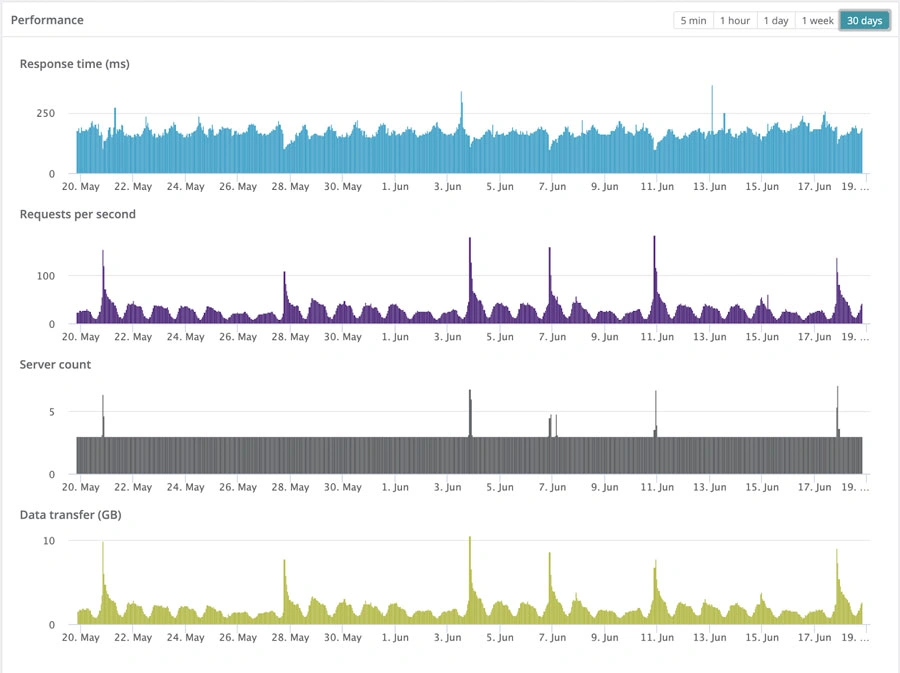
4. Monitoring website uptime and performance
Webscale’s portal allows you to monitor website uptime and performance in real-time. It enables you to monitor page response times, server count (due to scale out/scale in events), and data transfer rates, at any given time. Each detail has a date and time stamp and can be drilled into for further clarity.
You can also look at application server information – status (scale out/ scale in), number of sessions, and whether they’re running, stopped, or in maintenance mode. In addition, you can view all applications that are running, active clusters, and how long the website has been up.
These features are especially handy when you have a lot of projects going on in parallel, and generating a lot of event logs, that can be challenging to keep track of.
5. Keeping an eye out for cyberthreats
The threats section is very popular among our customers. It shows you all the Web Application Firewall (WAF) hits that your website has experienced, and the actions that Webscale’s automated system has taken to mitigate potential cyberattacks.
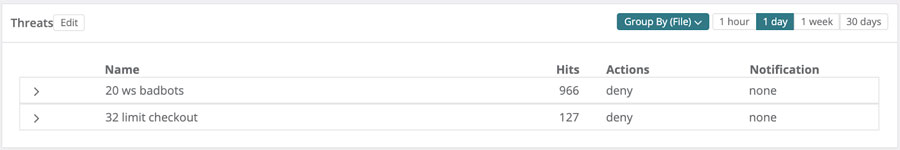
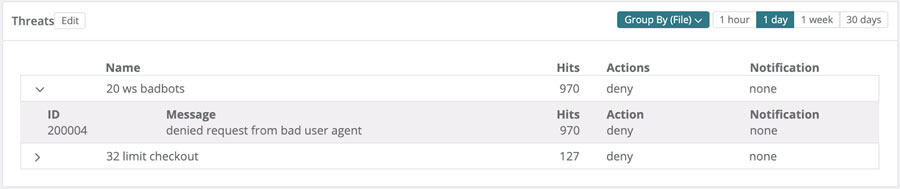
If you’re looking at the performance section and wondering why your response time has suddenly increased and servers have scaled out in an unusual manner (in the absence of any ongoing marketing promotions), you may need to take a look at the threats section and see if there are any bad bots hitting your website, or if something else is happening here.
You also have a list of whitelisted IP addresses here. These are IPs typically belonging to developers and site administrators, with access to log into the admin page and make changes to it.
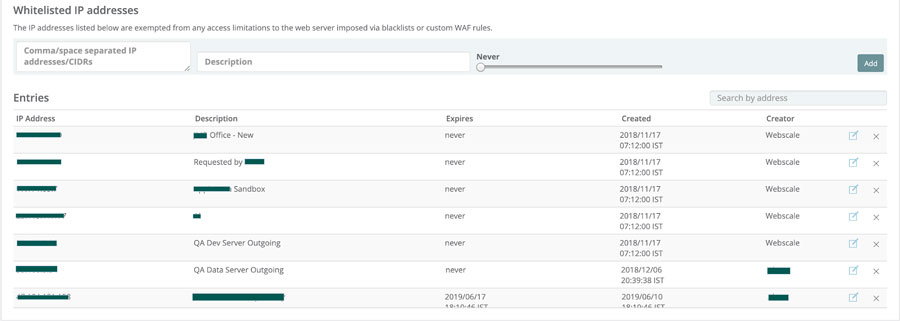
You can add and remove whitelisted IPs on the go or have a timeline for them to expire.
The security section in the portal also allows you to keep track of when your SSL certificates are expiring. This feature is particularly handy when you have multiple domains/applications.
6. Building rules and automating firewall actions using Web Controls
This is one of our most powerful features from an application control and security standpoint. With Web Controls, you can create the equivalent of firewall rules, without actually having to know how to build them.
An example of a simple Web Control would be – “if you’re using this IP, you can access the admin. But if you’re using any IPs from this block list, then deny access.” And there are many other examples, like blocking certain geographies from accessing your website.
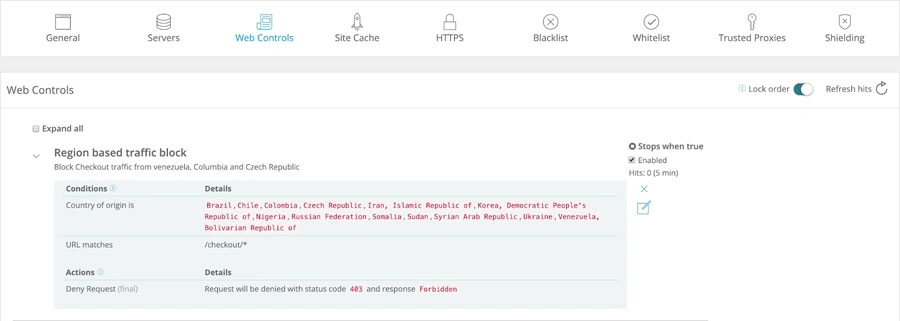
Web Controls are very easy to create, and have been designed specifically to allow users of all technical, and non-technical backgrounds, to quickly take actions to ensure the ongoing high performance, availability, and security of their websites.
This is a high level view of some of the most valued features of our portal, but there’s plenty more we could go into. If you think this level of insight would be valuable to your business, then fill out this form or drop us a line at sales@webscalenetworks.com and we’d love to set up a full demo for you.


