


With Kubernetes as the backbone of the CloudFlow Platform, we manage a large, complex network of globally distributed clusters with the goal of optimizing where and when our customers’ workloads are running to suit the needs of their application, while maintaining operational efficiency of the platform.
In order to maximize efficiency, we need a mechanism to dynamically expand and contract resources based on the demands of our customers’ applications at any given time. We rely on the Kubernetes Horizontal Pod Autoscaler (HPA) to scale services in a reliable, predictable, and controllable manner.
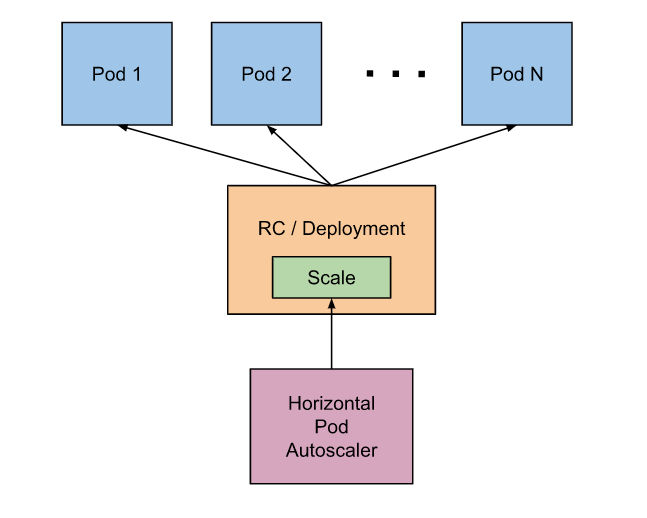
How the Horizontal Pod Autoscaler Works
The HPA controller runs regularly to check if any adjustments to the system are required. During each run, the controller manager queries the resource utilization against the metrics specified in each HorizontalPodAutoscaler definition. The controller manager obtains the metrics from either the resource metrics API (for per-pod resource metrics), or the custom metrics API (for all other metrics).
The HPA in its basic form is pretty powerful, but where the HPA starts to take on superhero status is when we start to introduce custom metrics to drive autoscaling intelligence.
To start, there are three different variables that need to be set before using the HPA. You set these within the HPA configuration itself:
- maxReplicas
- minReplicas
- some type of resource, or something to scale on
Resource type can be memory or CPU, which generally isn’t ideal for us to scale on because it can be extremely variable. Rather, we define and pull in custom metrics from Prometheus to get more granular in how we autoscale.
Incorporating Custom Metrics from Prometheus
We use the Prometheus Adapter for Kubernetes Metrics APIs to access the custom metrics on which to autoscale.
Using custom-metrics-config-map.yaml as a starting point, we can see that the default settings already include CPU and memory.
resourceRules:
  cpu:
    containerQuery: sum(rate(container_cpu_usage_seconds_total{<<.LabelMatchers>>}[1m])) by (<<.GroupBy>>)
    nodeQuery: sum(rate(container_cpu_usage_seconds_total{<<.LabelMatchers>>, id='/'}[1m])) by (<<.GroupBy>>)
    resources:
      overrides:
        node:
          resource: node
        namespace:
          resource: namespace
        pod_name:
          resource: pod
    containerLabel: container_name
  memory:
    containerQuery: sum(container_memory_working_set_bytes{<<.LabelMatchers>>}) by (<<.GroupBy>>)
    nodeQuery: sum(container_memory_working_set_bytes{<<.LabelMatchers>>,id='/'}) by (<<.GroupBy>>)
    resources:
      overrides:
        node:
          resource: node
        namespace:
          resource: namespace
        pod_name:
          resource: pod
    containerLabel: container_name
In this example, we’ll add some extra parameters to the config map. These are just PromQL queries with some substitutions that the Prometheus Adapter will fill in appropriately:
- Network received packets total – provided by the Node Exporter
- Request count – a custom metric that our pods expose for scraping to Prometheus. Not all our Pods have this metric, so packets received makes a decent proxy.
Here’s what it looks like:
rules:
- seriesQuery: 'container_network_receive_packets_total{namespace!="",pod_name!=""}'
  resources:
    overrides:
      namespace: {resource: "namespace"}
      pod_name: {resource: "pod"}
  name:
    matches: "^(.*)"
    as: "pps1m"
  metricsQuery: 'sum(rate(<<.Series>>{<<.LabelMatchers>>}[1m])) by (<<.GroupBy>>)'
- seriesQuery: 'container_network_receive_packets_total{namespace!="",pod_name!=""}'
  resources:
    overrides:
      namespace: {resource: "namespace"}
      pod_name: {resource: "pod"}
  name:
    matches: "^(.*)"
    as: "pps20m"
  metricsQuery: 'sum(rate(<<.Series>>{<<.LabelMatchers>>}[20m])) by (<<.GroupBy>>)'
- seriesQuery: 'section_http_request_count_total{namespace!="",pod_name!=""}'
  resources:
    overrides:
      namespace: {resource: "namespace"}
      pod_name: {resource: "pod"}
  name:
    matches: "^(.*)"
    as: "rps10m"
  metricsQuery: 'sum(rate(<<.Series>>{<<.LabelMatchers>>}[10m])) by (<<.GroupBy>>)'
- seriesQuery: 'section_http_request_count_total{namespace!="",pod_name!=""}'
  resources:
    overrides:
      namespace: {resource: "namespace"}
      pod_name: {resource: "pod"}
  name:
    matches: "^(.*)"
    as: "rps1m"
  metricsQuery: 'sum(rate(<<.Series>>{<<.LabelMatchers>>}[1m])) by (<<.GroupBy>>)'
The Prometheus adapter has a custom language it uses where it will substitute in namespace or pod, which allows us to query the custom metrics API so the HPA can use it. Read documentation.
metricsQuery: 'sum(rate(<<.Series>>{<<.LabelMatchers>>}[1m])) by (<<.GroupBy>>)'
Note, we can also rename the metric in the API with the following (seen in context above):
name:
  matches: "^(.*)"
  as: "rps1m"
In this example, we’re pulling in Requests Per Second (RPS) for each of our edge modules (e.g. WAF, caching, image optimization, etc.) so we can efficiently autoscale to accommodate the volume of requests at any given time.
Observability with HPA and Custom Metrics
While the HPA is tremendously powerful, it does require significant, ongoing tuning to realize its benefits. To this end, we use Grafana dashboards for a convenient way to view HPA activity, specific to a particular pod or environment.
In the example above, we can see an environment scaling up to ten replicas (from two) over a 24-hour window.
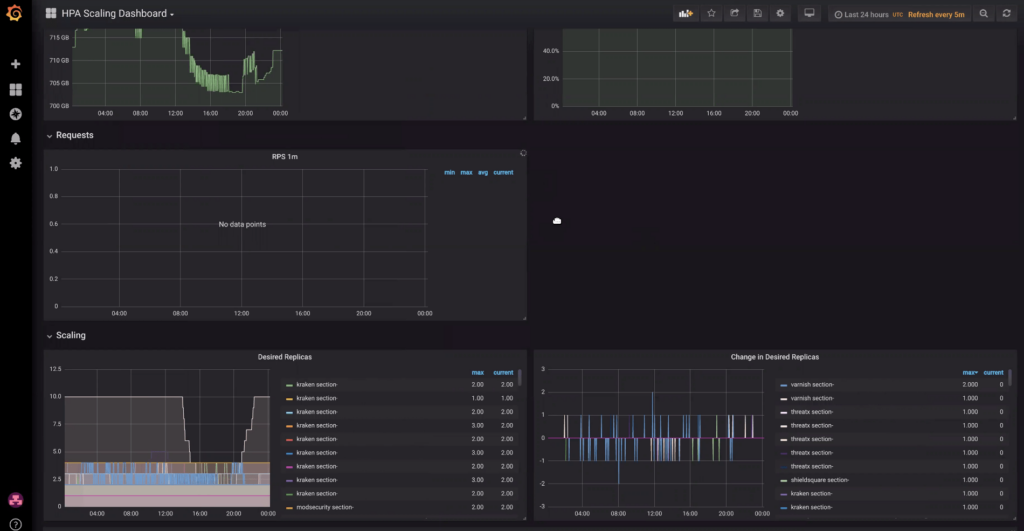
It’s important to note that each metric has its own scaling decision, which Kubernetes will collate and choose the highest value. For example, we might create a packets-per-second metric where we scale on a 20-minute window and on a 1-minute window. The 1-minute window can be useful to detect a big spike in traffic, whereas a 20-minute window can help indicate a longer-term traffic trend.
Whenever making custom settings, it’s helpful to consider whether you’re looking to adapt for spiky traffic or for a day/night cycle traffic pattern.
Of course, your work is likely not done once you’ve made a first pass at setting HPA values. Using a dashboard like the one above can help you adjust settings to suit your objectives. Do you want to run as few pods as possible to save money on nodes? Do you want to scale quickly to a maximum value? Appropriate settings will vary with the type of workload, and with ongoing software development, they may need adjusting over time.