
Real User Monitoring (RUM) is a passive monitoring methodology that captures all end user interactions with a website or application. While RUM has been widely used for over two decades now, it was mostly deployed by large enterprises only. However, the adoption of RUM skyrocketed after Google acquired Urchin, and rolled out Google Analytics which now includes the ability to measure the speed of your site. Several performance monitoring vendors such as Gomez, Keynote (Dynatrace), Catchpoint, Pingdom, Soasta and others offer their own versions of RUM, with varied features and functionalities. While there are various use cases of RUM, the usage has been mostly limited to the marketing/business teams in most organizations and in some cases, to developers. However, the data collected by RUM can help answer some critical questions for teams across the company – executives, business operations, finance, infrastructure and network operations, developers, product management, customer success and customer support. There are two main reasons that RUM only has partial adoption across businesses:
- Ignorance of the various use cases of RUM for the entire organization.
- No single solution designed to cater to all these use cases on a single platform.
In this blog, we will focus on these use cases and how they can help every function in an enterprise. Top 15 use cases of RUM 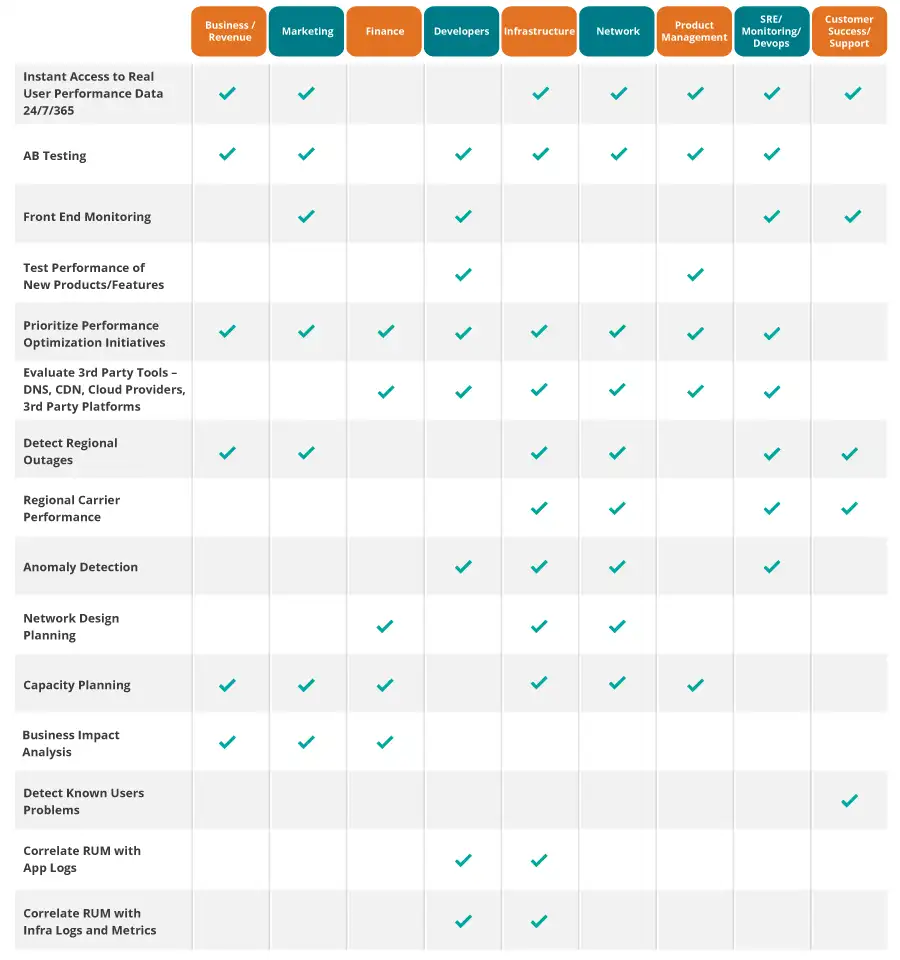 Yes, I know, there’s a lot in this table, but the real world adoption of RUM is similarly messy. Why?
- The dev team has specific needs, so they end up adding their own RUM tag.
- The marketing and business teams usually rely on a different set of analytics – Google, Omniture etc.
- The infrastructure/network teams also have their own RUM tag, that helps them correlate with the application and infrastructure logs.
- Other teams have reports built on Power BI, or other data visualization tools, that leverage data from some of the above data sources or in some cases, all of the above.
Yet, in some enterprises, even in many large Fortune 500 companies, most of the above do not exist. If RUM is to see wider adoption across the industry, a clear set of guidelines is needed. So, with that in mind, here is my simple 4-point framework, that I have put together based on a decade of working in the APM industry:
- Measure every single real user – product, feature adoption.
- Detect all anomalies – region, ISP, users, speed, devices, versions.
- Understand the business impact in case of an incident.
- Plan, design, test and prioritize optimization across infrastructure, network, application and features.
Webscale’s approach to RUM Being one of the largest cloud platforms for modern ecommerce, we are responsible for the automation, continuous deployment, integration, auto-scaling, security and performance optimization, of all the ecommerce applications we manage. Providing visibility into the application health for our customers is an important part of what we do. Delivering on this commitment, our customers have access to their Web Access logs in the Webscale control panel that allows them to analyze the traffic in real-time, diagnosing performance problems or errors as shown in the images below: Example 1: In the snapshot below, the users were able to quickly detect any latency on the server side. 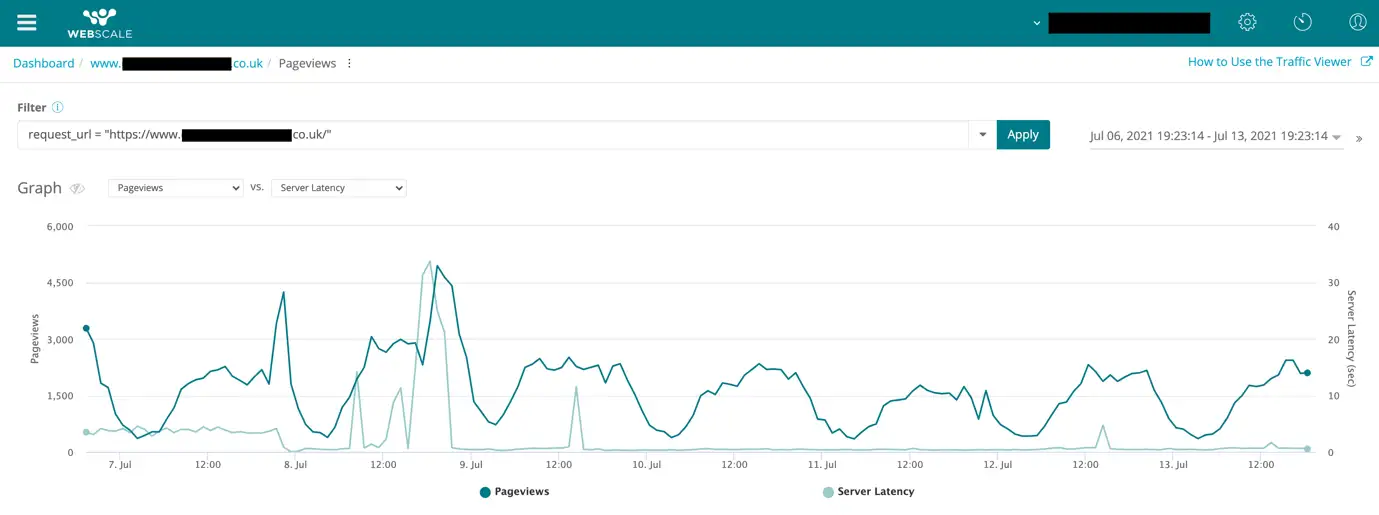 Example 2: In the snapshot below, the users are able to quickly detect which requests were being rejected when the latency on the server side increased.
 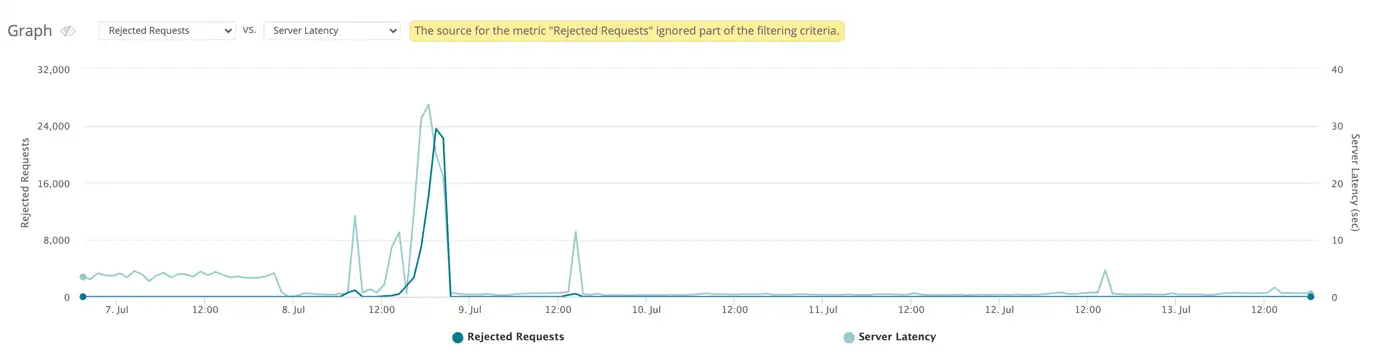 This ability to detect and diagnose any issues at the origin is powerful. With Core Web Vitals (CWV) now fully deployed, optimizing these metrics is critical for our customers. So, to help them better manage and optimize their CWV, we rolled out Real User Monitoring (RUM) – we actually went deeper on this in a recent blog. This is unique because our customers are now able to understand user experience, optimize CWV and measure the improvements, and also correlate their end users’ experience with their web access logs. All of this through a single pane of glass, as shown below:
 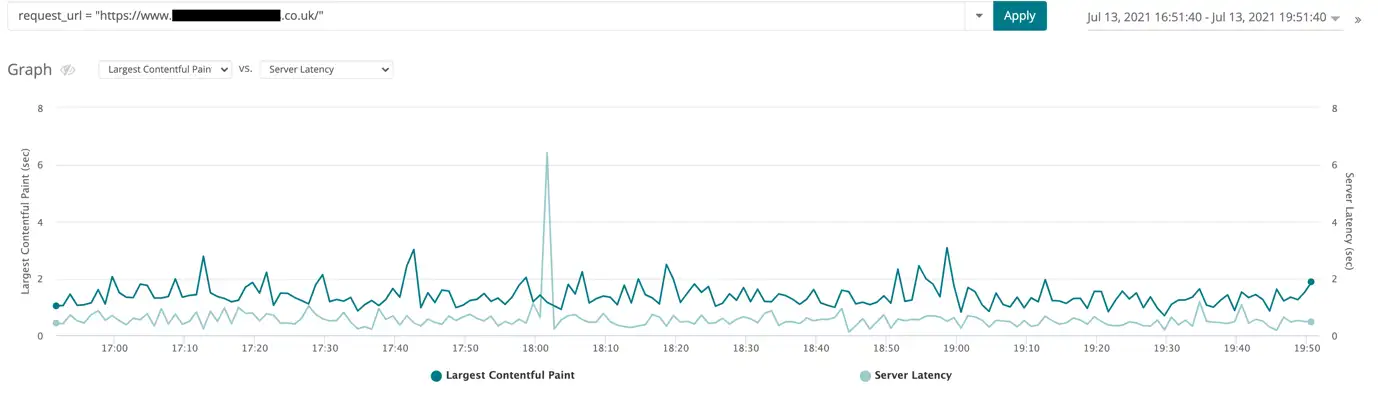 Webscale customers are now able to:
- Detect issues impacting their end users.
- Identify areas to optimize.
- When there is an incident, correlate and analyze the impact it had on their business.
- Correlate end-user experience with access logs that highlight issues happening within the origin.
- Identify pages, requests, content type and anything that needs to be optimized.
- Measure the performance impact while rolling out new features.
While this is just the first version of our Real User Monitoring solution, we are excited about the possibilities and potential this brings to our customers and community at large. Like to learn more about how Webscale is helping ecommerce merchants stay ahead with RUM? Reach out to us at info@webscale.com. Enjoy your RUM!


